
What is a Psychrometric chart?
A psychrometric chart is a graphic representation of thermodynamic properties. The chart is used in building design and HVAC engineering to plot air conditions, calculate heating/cooling loads, and track HVAC processes.
Dry-Bulb Temperature
Ambient air temperature measured by a standard thermometer unaffected by humidity or direct thermal radiation
Wet-Bulb temperature
Temperature measured by a thermometer in a water-soaked wick with air passing over. It reflects total heat content and evaporative cooling capacity.
Relative Humidity(RH) vs. Specific Humidity (SH)
RH: It measures how close the air is to being saturated with water vapor at a given temperature.
SH: It measures the mass of water vapor per unit mass of air, expressed in units such as "g/kg". It is independent of temperature and air volume; that means as long as no water vapor is added or removed, the specific humidity remains constant regardless of whether the air temperature goes up or down.
Saturation Line
The 100% relative humidity boundary curve on a psychrometric chart where dry-bulb and wet-bulb temperature are identical
Dew point temperature
100% saturated with water vapor and moisture begins to condense into liquid.
Mean Radiant Temperature (MRT)
Weighted average surface temperature of all surrounding materials facing an occupant. It governs radiant heat exchange.
Operative temperature
Operative temperature is a weighted average temperature that combines air temperature and mean radiant temperature to represent the overall thermal comfort experienced by an occupant.
For example, you are sitting next to a large floor-to-ceiling double-glazed window. The thermostat on the wall reads a cozy 72°F. Because it's freezing outside, the inner glass surface temperature has dropped, and your surrounding Mean Radiant Temperature (MRT) drops to around 56°F in that perimeter zone. Below is how to calculate how you feel in that environment.
Operative Tem=[72°F (Drybulb)+ 56°F (MRT)]/2 =64°F
PS. The equation listed above is a simplified version. It isn't always a simple 50/50 split. It is a weighted average, where the weighting depends on air velocity. At low air speed (less than 40 fpm), convective and radiant heat transfer are roughly equal, so it simplifies to the average of 2. At higher air speed, convective heat transfer dominates, so the air temperature gets a higher weighting in the formula.
Sensible Heat
Thermal energy that changes dry-bulb air temperature without changing the moisture content of the air.
Latent Heat
Thermal energy absorbed or released during a phase change, without altering dry-bulb temperature.
Sensible Heat Ratio (SHR)
Ratio of sensible heat load to total heat load (=sensible heat+latent heat)in a conditioned space. In other words, it is simply the percentage of that total cooling load that goes toward dropping the air temperature (sensible heat) versus removing humidity (latent heat)
SHR= Sensible Capacity/ Total Capacity
High SHR (over 0.85+) means the cooling load is almost entirely temperature-driven
Reading the Psychrometric Chart…
Basics:
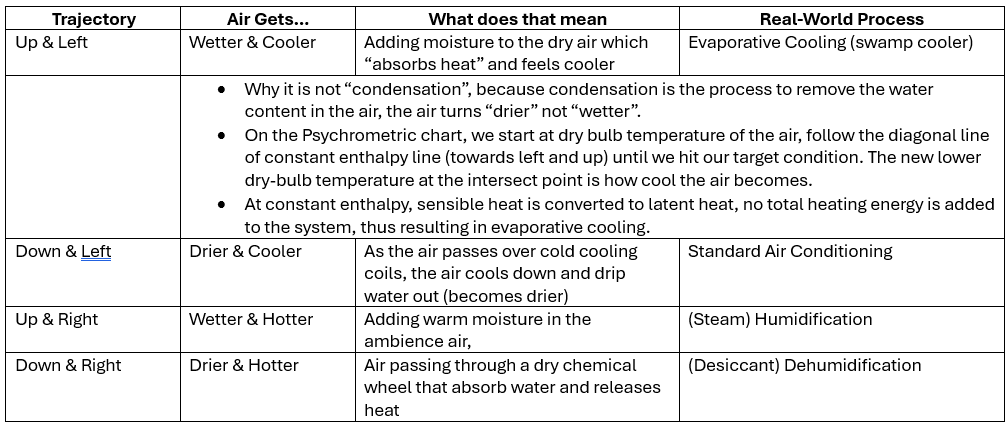
Move Trajectory Horizontally Left on Psychrometric Chart: Sensible cooling process at a constant specific humidity ratio.
Move Trajectory Horizontally Right on Psychrometric Chart: Sensible heating process at a constant specific humidity ratio.
How does Psychrometric chart explain our Comfort Zone?
Setting baseline: We start at our comfortable baseline, say 75 °F DBT at 50% RH.
Altering moisture contemt: In the chart, we can think of adding the moisture content (move up along SH line) to the same dry-bulb temperature line.
Tracing back along same comfortable curve: Then trace the RH curve/same-comfort line back to the left.
Looking for intersection: To keep the same level of skin comfort, we need to shift the dry-bulb temperature to the left intersect point (cooler temperature) as humidity rises.
What’s the Impact of High Indoor Relative Humidity?
When indoor relative humidity (RH) rises above the recommended range (about 40%~60%), it triggers a cascade of issues affecting human comfort, occupant health, building systems, and structural durability. For example
Human Comfort: Inhibited Evaporative Cooling
The human body cools itself primarily through the evaporation of sweat from the skin. When surrounding air is saturated with moisture, sweat cannot evaporate efficiently into the air.
Indoor Air Quality: Biological Contaminant Growth
Mid-range humidity minimizes airborne pathogen viability. High humidity creates a prime breeding ground for biological agents. For example, mold and mildew grow on organic surfaces when elevated humidity persists for more than 24-48 hours.
PS. Refer to EPA's course: Why and Where Mold Grows.
Building Envelope Durability: Surface Condensation
When air with high RH meets a colder interior surface, it cools to the dew point temperature and condenses directly onto that surface. That phenomenon leads to material degradation, such as drywall softening and sag, paint peeling, or metal joints corroding over time. When the condensation occurs within wall cavities, it damages insulation performance and creates hidden mold hazards that are difficult to remediate.
HVAC energy: Latent Cooling Overload
To lower humidity, active cooling coils must drop air temperature below the dew point to condense out moisture. The process demands significant latent energy capacity.
How to find a Dew Point in a Psychrometric Chart?
For example, finding a Dew Point for Air at 75°F at 70% RH
look for the 75°F temperature line at the bottom scale (dry bulb).
follow its vertical line and move up to meet the 70% RH curve.
draw an imaginary horizontal line towards the left to the edge (where the 100% RH curve is).
Read the degree on the wet-bulb/dew point temperature, and you will get 64°F as the approximate Dew Point.
By the way…
If you like this article, you might also like How to Beautify Home & Boost Your Immune System.